Advantages
-
Create interactive visualizations using Data Studio drag and drop functionalities quickly.
-
Deeper insights let you make strategic decisions.
-
Collaborate with your team to analyze data.
Customize your visual dashboards according to your preferred devices automatically using Google Data Studio.
Let’s dive deeper into this integration:
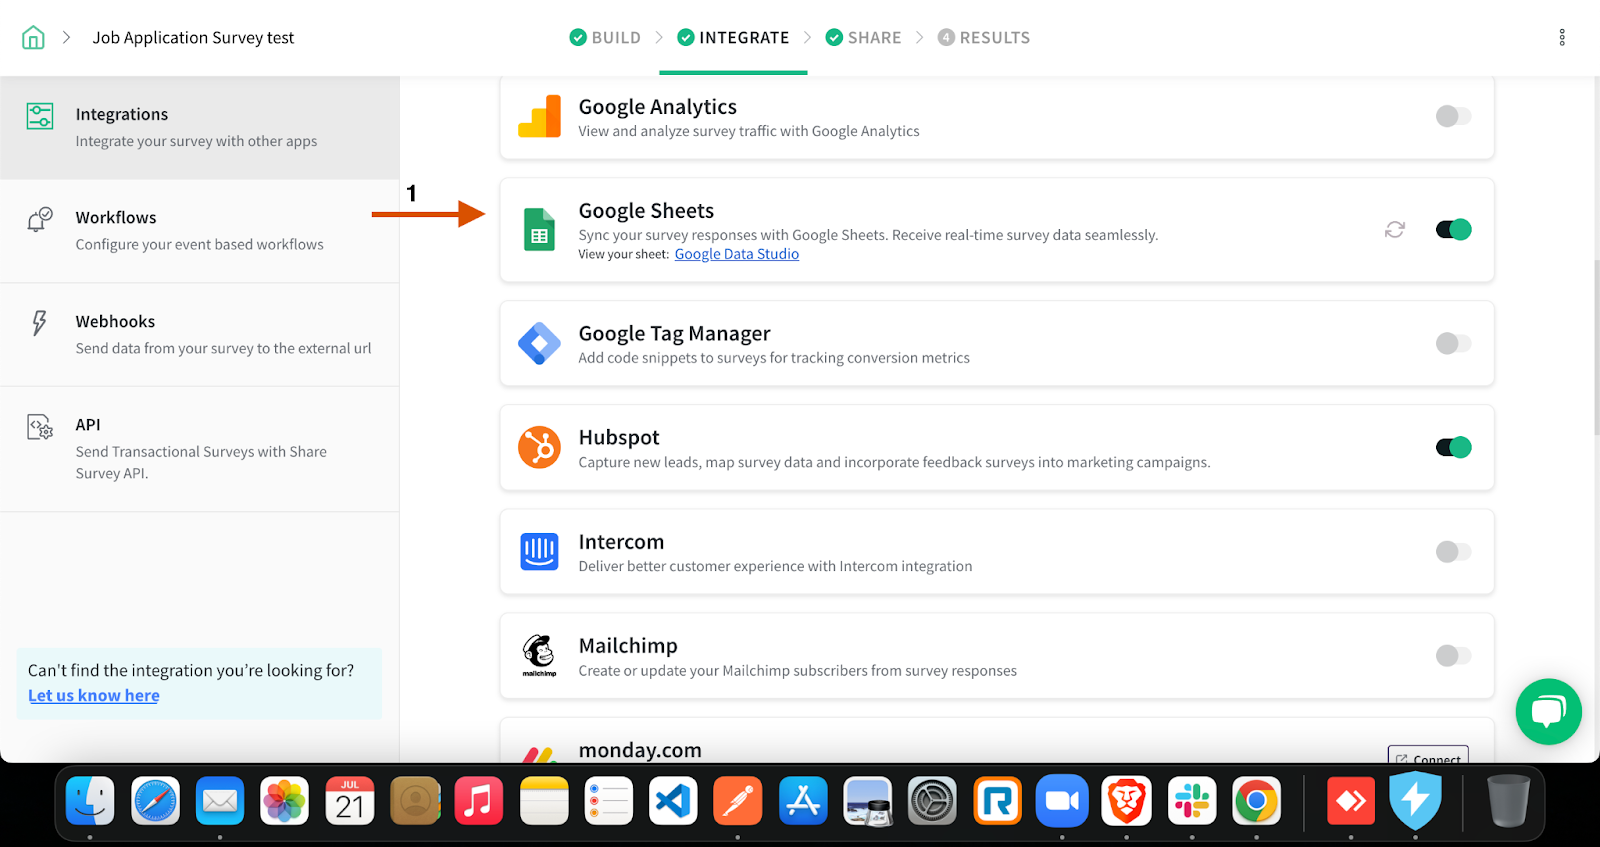
- Once you are done building your survey, Navigate to the Integrate tab and enable the Google Sheets toggle.
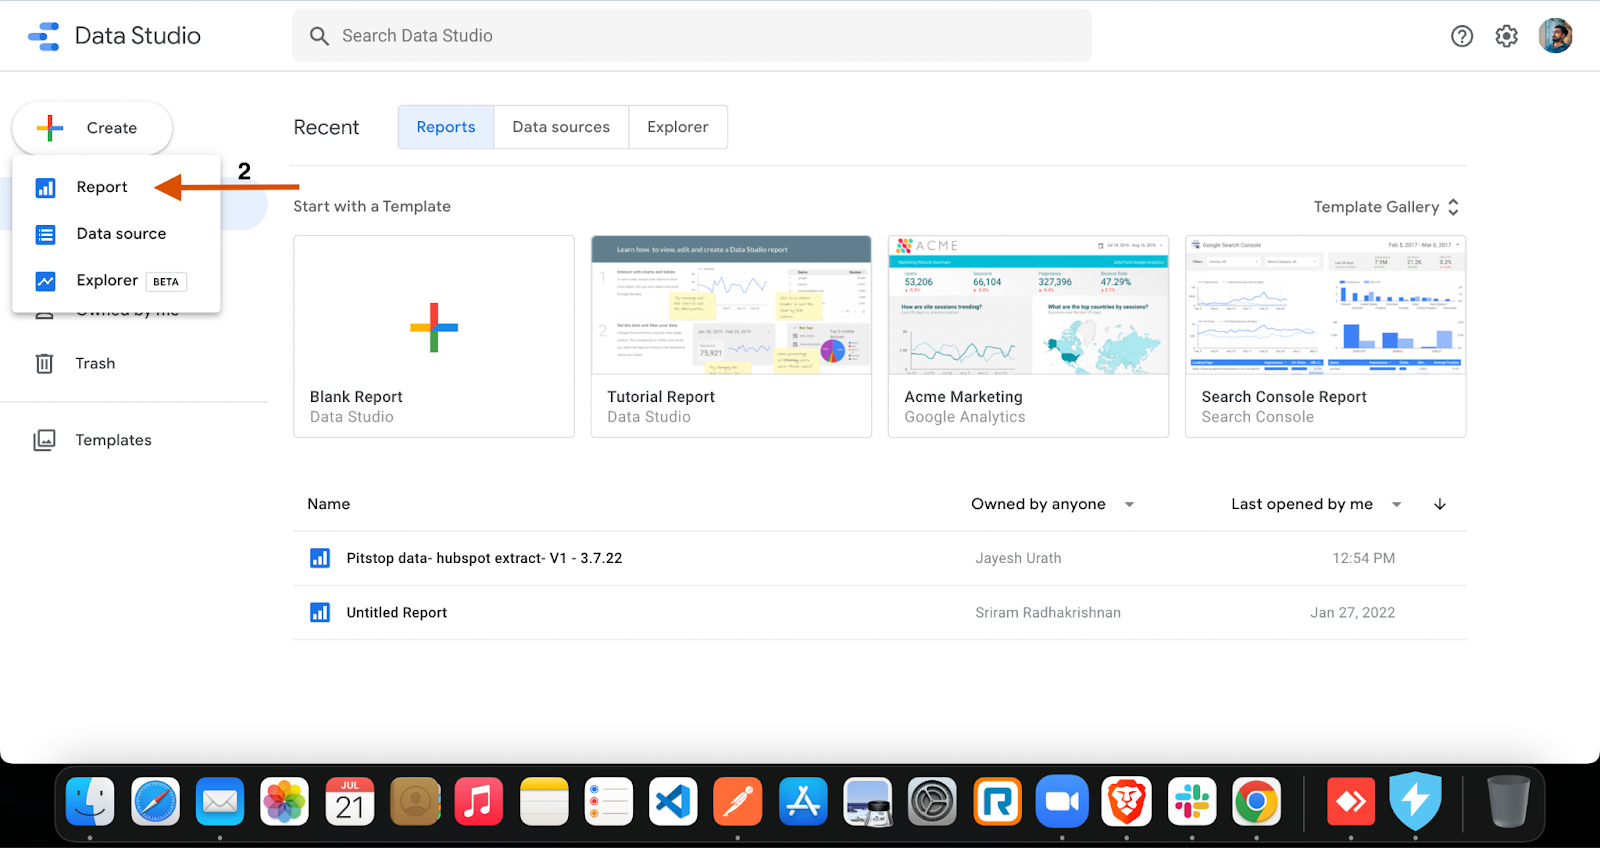
2. Sign In to Google Data Studio, head to the Create menu, and select Report.
-
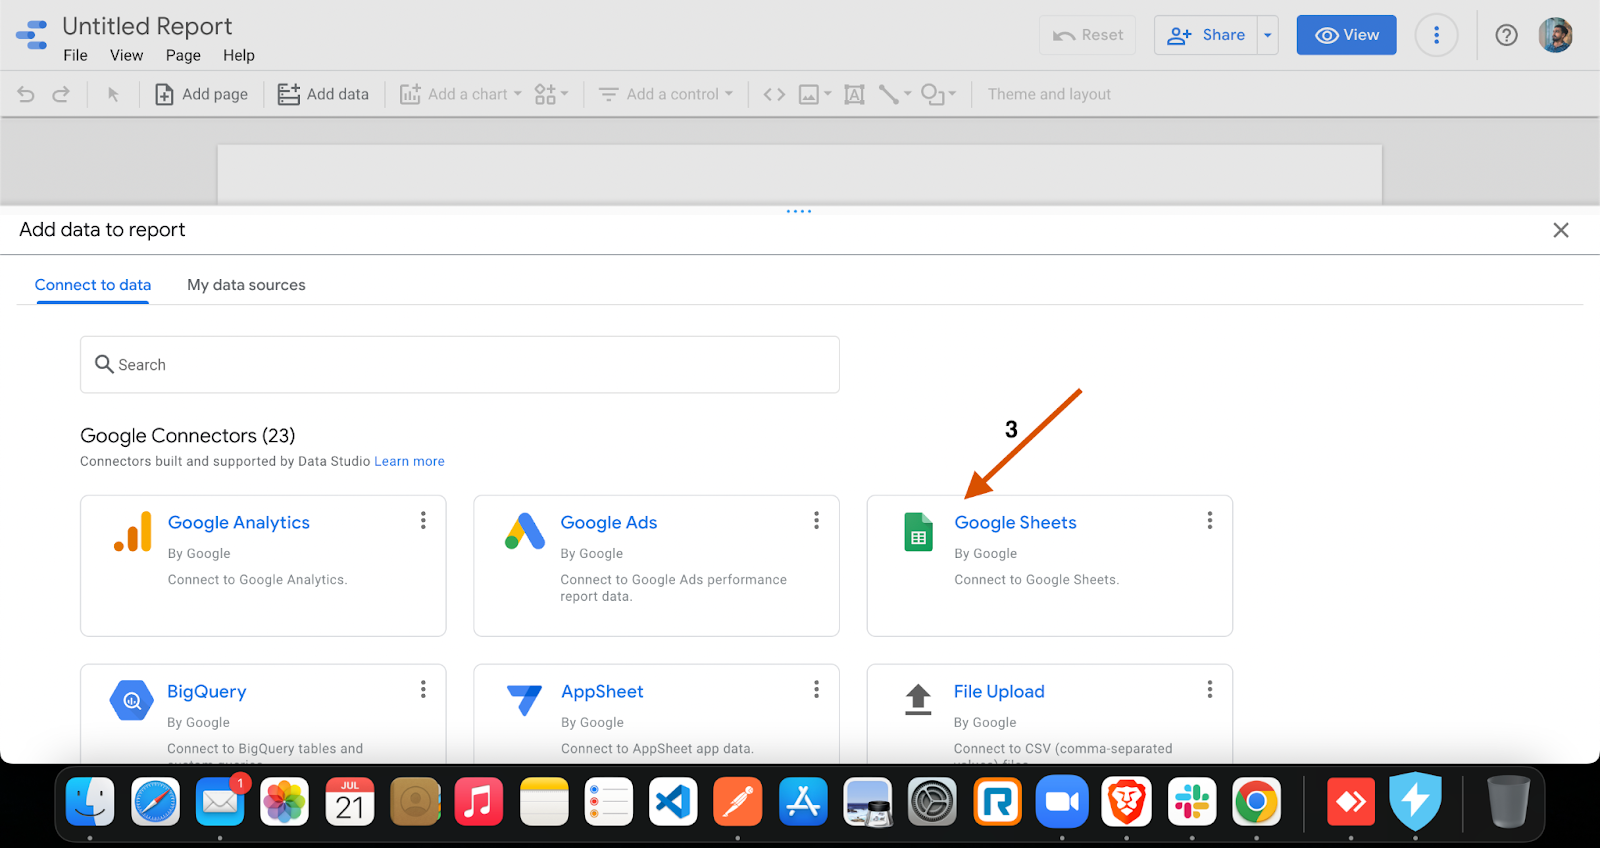
Select Google sheets under “Connect to Data.”
-
Select the spreadsheet and worksheet in the window and click on Add.
-
You’ll now be able to see the survey data pushed to Google Data Studio. You can view the data in different graphical visualizations, the way you prefer.